
Students (A.Y. 2025/26)
- 38,222 total students
- 6,063 first year students
- 21,905 enrolled in Bachelor's degree programmes
- 16,138 enrolled in Master's degree programmes
- 420 students enrolled in 1st and 2nd level Specializing Master’s programmes, Lifelong Learning courses and training courses for businesses
- 1,776 Ph.D candidates
- 27,4% female students
- 22,4% internationsl students
- 50,6% Italians students living outside Piedmont
Graduates 2025
- 8,547 graduates
- Bachelor's degree 3, 809 (Average age 23,5)
- Master's degree 4, 738 (Average age 26,2)
Course Catalogue A.Y. 2026/27
- 26 Bachelor's degree programmes (4 in Architecture, Design and Spatial Planning - including 1 in cooperation with another university - and 22 in Engineering - including 1 in cooperation with another university )
- 36 Master's degree programmes (9 in Architecture, Design and Spatial Planning - including 2 in cooperation with other universities - and 27 in Engineering - including 1 in cooperation with another university)
- 35 educational paths taught completely in English
- 36 1st and 2nd level Specializing Master’s programmes and Lifelong Learning courses
- 16 Ph.D programmes, including 5 in cooperation with other universities (3) and research centres (2)
- Percorso Intraprendenti - for Bachelor's students
- Percorso Early Research Honors School - for Bachelor's students
- Percorso Alta Scuola Politecnica (ASP) for Master's students
- Percorso Early Research Honors School for Master's students
- Percorso UROP - Undergraduate Research Opportunities Programme for Master's students
Master's graduates employed one year after graduation
Almalaurea XXVII survey (2025):
- PoliTO graduates: 96%
- Industrial and Information Engineering: 96,1%
- Architecture and Civil Engineering; Arte and Design: 95,8%
Students satisfaction rate from the Almalaurea survey
The satisfaction rate of our Master's students for the degree programme amounts to 90,1%; 85,1% of our Master's graduates would enrol again at Politecnico di Torino, among them, 72,5% would enrol in the same degree programme, while 12,6% would choose another programme (*Source: Almalaurea 2025).
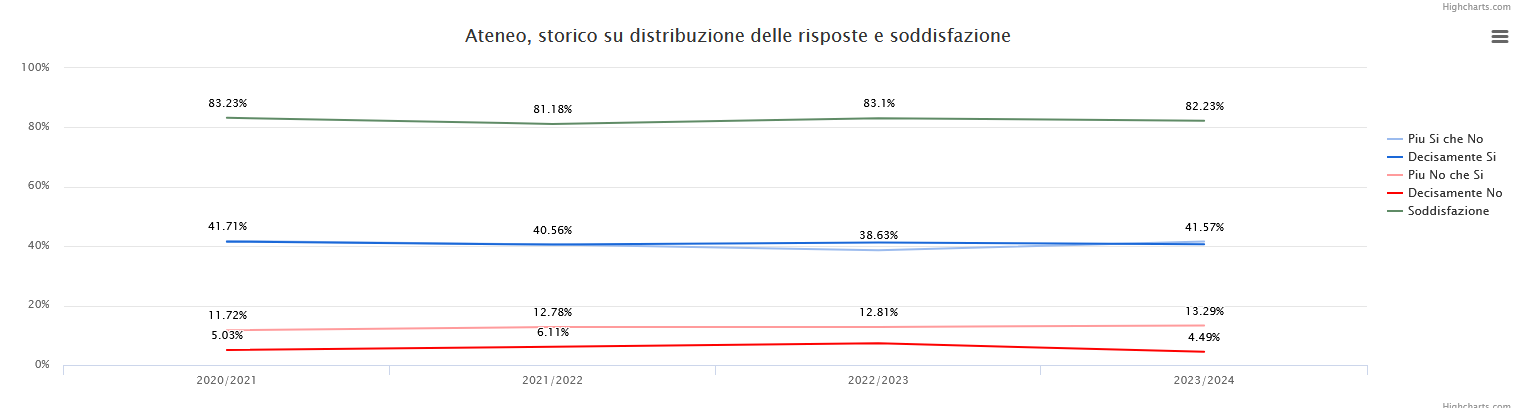
Students’ satisfaction rate based on the report of the Joint Committee for Teaching
The general satisfaction rate for the overall educational path has been around 82% in the latest years, without major changes during the pandemics.
In particular, more than 88% of students were satisfied with the interaction with the professors and with the university infrastructures (*Source: annual report of the Joint Committee for Teaching, 2023-2024).
Scholarships
84% of Ph.D candidates receive a scholarship
Ph.D. grants are 16% higher than national average
48 Ph.D. programmes offered in apprenticeship format
International Ph.D candidates
- 24% of all Ph.D. candidates
Excellence of Ph.D students
- 80% of Ph.D graduates scoring 105/110
- 60% of Ph.D graduates scoring 110/110